What algorithmic solution would you use for this scenario?
The Project In a “Nutshell”
Use an algorithmic solution to predict with 70%+ accuracy in as close to real time as possible the increase and decrease of at least three numeric incremental movements for a few selected primary value inputs (example: five values) by cross referencing multiple numeric inputs (example: 100+ inputs) live streamed at refresh rate of 0.2 seconds.
The Primary and Supporting Grids
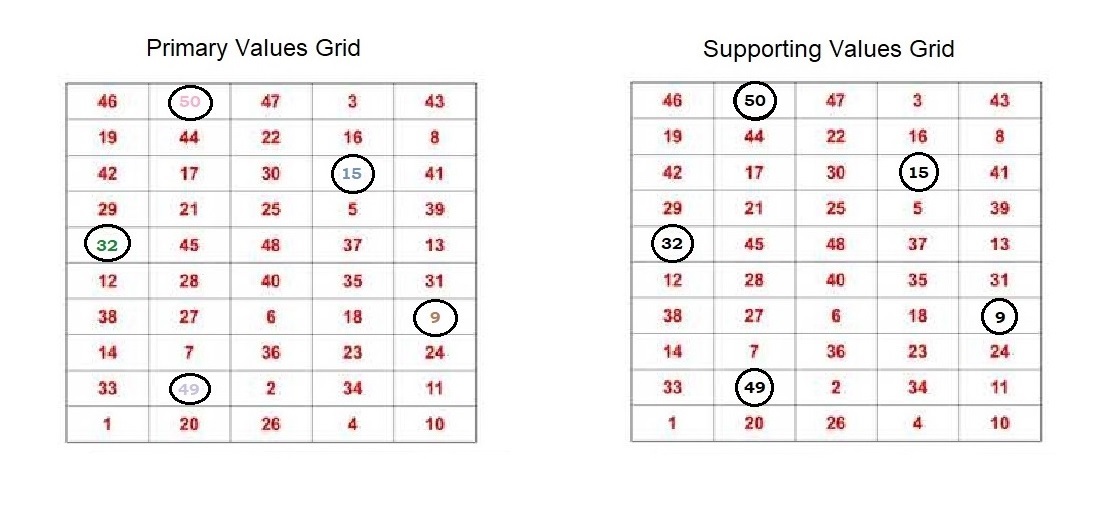
There are two main types of input data streams, “Primary” and Supporting” as explained below and which can be visualized by the two visual example reference grids. There will only ever be one primary grid but there could be multiple supporting grids, the picture reference example has only one supporting grid shown.
Both example grids show fifty individual input squares in each grid, but that amount will change according to needs. The input values in every grid square are to be understood as “fixed in place” which means whilst the numerical values within each grid square will change, the actual data stream input for each grid square is always the same one.
Note: The amount of pre-chosen grid square data streams shown in the primary grid example is five, but that may be changed for another amount depending on requirements.
Example grid picture explanations
The left Grid is the “Primary Values” grid. There are five selected individual values represented by the differently coloured numbers (circled). All values in the grid are “live” for cross referencing but only the selected grid data stream values would be for prediction. All the values will be changing regularly but it is important to know they increase and decrease in increments of 0.01, so one increment movement increasing, for example, would be going from “5 to 5.01”. The overall goal is to predict the incremental movement mentioned in the opening title “Nutshell” of at least a trend movement of three (example 5 – 5.03) with a 70% accuracy.
The Right Grid is an example of only one (1) “Supporting Values” grid. Notice the same grid numbers as the primary grid are all black (circled) to show these are not for prediction output themselves, however they are still linked directly to the corresponding Primary Grid interface values relative to their grid position. All the values in grid are “live” and used for cross referencing purposes. The data stream input values of supporting grids are from different sources and can either increase or decrease in increments or fluctuate in varying amounts of no specific order.
BACK
The Project In a “Nutshell”
Use an algorithmic solution to predict with 70%+ accuracy in as close to real time as possible the increase and decrease of at least three numeric incremental movements for a few selected primary value inputs (example: five values) by cross referencing multiple numeric inputs (example: 100+ inputs) live streamed at refresh rate of 0.2 seconds.
The Primary and Supporting Grids
There are two main types of input data streams, “Primary” and Supporting” as explained below and which can be visualized by the two visual example reference grids. There will only ever be one primary grid but there could be multiple supporting grids, the picture reference example has only one supporting grid shown.
Both example grids show fifty individual input squares in each grid, but that amount will change according to needs. The input values in every grid square are to be understood as “fixed in place” which means whilst the numerical values within each grid square will change, the actual data stream input for each grid square is always the same one.
Note: The amount of pre-chosen grid square data streams shown in the primary grid example is five, but that may be changed for another amount depending on requirements.
Example grid picture explanations
The left Grid is the “Primary Values” grid. There are five selected individual values represented by the differently coloured numbers (circled). All values in the grid are “live” for cross referencing but only the selected grid data stream values would be for prediction. All the values will be changing regularly but it is important to know they increase and decrease in increments of 0.01, so one increment movement increasing, for example, would be going from “5 to 5.01”. The overall goal is to predict the incremental movement mentioned in the opening title “Nutshell” of at least a trend movement of three (example 5 – 5.03) with a 70% accuracy.
The Right Grid is an example of only one (1) “Supporting Values” grid. Notice the same grid numbers as the primary grid are all black (circled) to show these are not for prediction output themselves, however they are still linked directly to the corresponding Primary Grid interface values relative to their grid position. All the values in grid are “live” and used for cross referencing purposes. The data stream input values of supporting grids are from different sources and can either increase or decrease in increments or fluctuate in varying amounts of no specific order.
Summary:
- There is a direct relationship for all the "pairing" of values (same grid square location) between the two main types of grids, but overall every grid square is being monitored and cross referenced by the algo to find trends.
- The algo will need to give a prediction accuracy percentage output for each selected primary value and continuously re-evaluate and update the percentage strength as needed.
- The main goal is to predict the incremental movements of the selected primary values in real time to an accuracy of 70% or more.
My project progression to date:
Thus far I’ve coded a working infrastructure in Python with a no-sql database (mongoDB) and am now studying solutions based on Deep Learning and LSTM (using Keras/TensorFlow). My programming background has not been extensive with ML but I’m enthusiastic with the learning curve. Maybe a similar algorithmic solution might be those used in real time image recognition or possibly algo's that are used for live financial market trading price prediction. Unfortunately I have the constraint of a NDA and can’t fully divulge the end use for this project, but hopefully the details given are enough to understand the concepts and I will answer questions as best that I can. Any advice would be very appreciated on which direction/s to explore the algorithm/data-science side of this project, thank you for reading this and hopefully taking some time to reply.